
Beginner Tips
13 min read
How to Be a Funded Trader in 2025
To become a funded trader in 2025, you must pass prop firm challenges by mastering strategy, risk control, and trading rules.
7 min read
Share
In this article, we discuss candlestick patterns, including what they are, how to read them, and how to incorporate them into your forex trading.
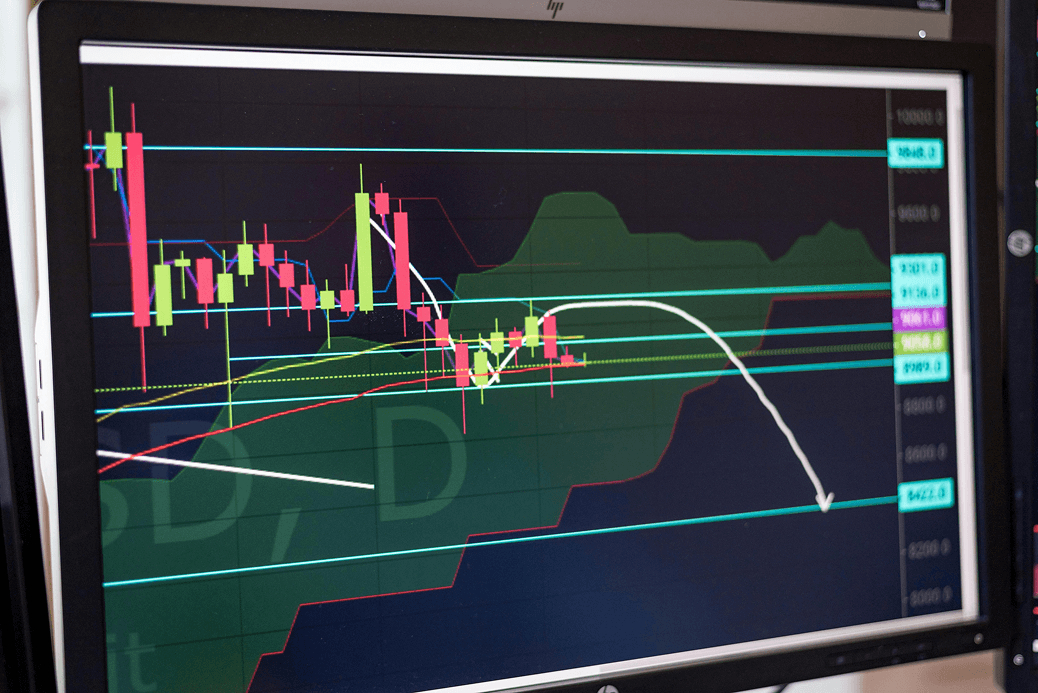
The foreign exchange market presents several opportunities through careful technical analysis of price action. Among the technical analysis tools, the candlestick chart reveals deep insights into market psychology and potential price movements.
These time-tested indicators provide crucial information about buyer and seller sentiment during specific time periods.
Understanding how to incorporate candlestick patterns into your forex trading strategy requires both technical mastery and hands-on experience. Many retail investors struggle to implement these patterns effectively, leading to inconsistent results.
However, successful traders understand how to effectively read and interpret candlestick patterns, which can lead to more consistent returns in the forex market.
The foundation of successful trading begins with understanding individual candlestick formations. Each pattern tells a story through opening and closing prices, revealing the ongoing battle between buyers and sellers.
The relationship between these price levels creates the candle's body, while the upper and lower wicks of the candle demonstrate price rejection at extremes.
Green candlesticks indicate strong buying pressure, appearing frequently during bullish trends. When multiple long green candles form in sequence, they often signal strong upward momentum.
Conversely, tall bearish candles indicate significant selling pressure, particularly when appearing after extended upward trends.
Advanced pattern recognition requires understanding both single formations and complex combinations. While engulfing patterns, such as the bearish engulfing candlestick pattern, might signal potential reversals, confirming factors like volume and market context increase trade probability.
Experienced forex traders use these patterns - combined with other indicators to develop a systematic approach to high-probability setups across multiple timeframes.
Among bullish reversal signals, the hammer candlestick pattern holds particular significance. Characterized by a small body and long lower wick, this formation suggests strong buying pressure absorbing selloffs.
When appearing after extended downtrends, especially with increasing volume, hammer patterns often precede significant recoveries.
Understanding bearish formations, such as the bearish pattern, is crucial for trading strategies. The bearish engulfing pattern occurs when a large red candle completely engulfs the previous green one, often signaling trend exhaustion.
This particular candlestick pattern gains reliability when appearing near resistance levels or after strong upward trends. This is why it is vital to use complementing indicators to verify or confirm your price action thesis.
Another significant bearish signal emerges through the hanging man candlestick pattern. Similar in appearance to the hammer but appearing during uptrends, this formation suggests waning bullish momentum.
It's important to combine this pattern with the previous trend's strength and volume characteristics when evaluating hanging man patterns.
The evening star candlestick pattern represents a complex reversal formation. Beginning with a tall bullish candle, followed by a small second candle showing indecision, and completed by a bearish third candle, this pattern often precedes significant downturns.
Proper reading of candlestick patterns like these requires careful attention to formation details and surrounding market context.
This bearish reversal signal manifests when a second candle opens above the previous closing price but closes well into the body of the prior candle. Dark cloud cover patterns gain significance when appearing after strong upward trends, particularly at key resistance levels.
Professional forex traders often combine this pattern with volume analysis and broader technical indicators for trade confirmation.
Recognizing bullish formations helps traders identify potential buying opportunities. The bullish engulfing candlestick pattern, appearing when a large green candlestick completely envelops the previous bearish candle, suggests strong buying pressure entering the market.
This classic pattern gains reliability when forming near established support levels.
Successful traders combine candlestick patterns with multiple technical analysis tools. Support from trend lines, volume indicators, and broader market sentiment helps validate potential trade setups.
The best candlestick patterns often align with multiple confirming factors before triggering trade entries.
The doji candle, forming when opening and closing prices nearly match, signals potential market indecision. This particular candlestick pattern gains importance when appearing after extended trends.
Different doji variations provide unique insights into market psychology. Long-legged doji patterns suggest increased volatility, while dragonfly doji formations near support levels might indicate potential bullish reversals.
Understanding these nuances helps prevent losing money rapidly through misinterpretation.
Reading candlestick patterns effectively requires understanding how market conditions affect pattern reliability. It's important to adapt your strategies based on changing market dynamics and volatility levels.
Successful implementation of candlestick analysis requires systematic trading strategies. Retail investors benefit from combining multiple candlestick formations with broader technical analysis.
Understanding how the exact opposite of bullish patterns can create bearish signals helps traders identify reversals.
While reversal patterns attract significant attention, continuation patterns prove equally valuable. These formations help traders identify temporary pullbacks within established trends.
The harami pattern family often signals potential trend continuation, particularly when supported by favorable volume characteristics.
Combining candlestick patterns with traditional technical analysis enhances trading results. Chart pattern analysis, including trend lines and support/resistance levels, provides crucial context for pattern interpretation.
Understanding price action through candlestick formations requires comprehensive market knowledge. Previous closing price levels often serve as reference points for pattern validation.
Green candlestick formations breaking above resistance suggest strong buying pressure, especially when accompanied by increasing volume.
It's essential to analyze candlestick patterns across various timeframes. A bearish engulfing pattern on higher timeframes often carries more weight than similar formations on shorter intervals. Understanding how patterns align across multiple time periods can enhance trade probability.
Successful traders combine candlestick patterns with multiple technical indicators. Moving averages, momentum oscillators, and trend lines provide additional confirmation for pattern-based trades. This systematic approach helps avoid common pitfalls in pattern recognition.
Not all candlestick formations carry equal weight. The best candlestick patterns often appear at key technical levels with strong volume confirmation. Understanding how particular time periods affect pattern development improves trade timing.
Previous trend strength significantly impacts pattern reliability. A bullish reversal pattern gains credibility when appearing after extended downtrends, especially near support levels. Similarly, bearish candle formations carry more weight at resistance after strong upward trends.
Trading strategies based on candlestick patterns require volume analysis. Increasing volume during pattern formation suggests stronger trader conviction. This becomes particularly important when trading CFDs or during major market events.
Key price levels significantly impact pattern reliability. A bullish candle breaking resistance carries more weight than similar formations in neutral zones. Trading strategies incorporating these levels often produce higher probability setups.
Beyond basic patterns, sophisticated traders recognize complex candlestick combinations. The exact opposite of a bullish pattern often creates equally valid bearish signals. First candle characteristics frequently predict subsequent pattern development.
When several candlestick patterns align at key levels, trading opportunities gain strength. Successful forex traders look for pattern confluence with other technical indicators. This approach helps avoid losing money rapidly through false signal interpretation.
Professional traders read candlestick patterns within broader market context. Previous closing price levels often influence pattern interpretation. The bullish trend gains credibility when supported by multiple technical factors.
Understanding why patterns fail proves as valuable as recognizing successful formations. Many retail investor accounts improve performance by studying pattern failures. This analysis helps prevent losing money rapidly through premature trade entry.
Successful trading systems combine multiple candlestick patterns with broader analysis. The harami pattern family, shooting star pattern, and other formations provide complementary signals. Understanding how different patterns interact with each other helps improve trade selection.
Mastering candlestick patterns in forex trading requires dedication and systematic practice. While the best candlestick patterns provide valuable signals, successful trading demands comprehensive analysis and strict risk management.
The foreign exchange market continues evolving, but candlestick analysis remains fundamental. Whether trading classic pattern formations or complex combinations, understanding price action through candlestick patterns provides crucial market insights.
13 min read
To become a funded trader in 2025, you must pass prop firm challenges by mastering strategy, risk control, and trading rules.
9 min read
Discover effective AI trading strategies for prop firms to enhance your profits. Learn practical tips to navigate the market successfully. Read more!

8 min read
Instant funding prop firms are becoming increasingly popular, but should you participate?
10 min read
Learn effective strategies to successfully pass a prop firm challenge. Gain insights and tips to enhance your trading skills. Read the article now!
16 min read
Discover the essentials of proprietary trading and learn what a prop firm is. Understand the benefits and risks involved. Read the full guide now!
Get an insight from other users about SeacrestFunded and their experiences. 131K+ members and counting

Get instant access to weekly newsletter.