
18 min read
Funded Trading Accounts Explained: Types, Benefits & How to Get One
A funded trading account gives you access to a firm’s capital to trade, share profits, and reduce personal risk.
8 min read
Share
Although the Forex Markets can be unpredictable and highly volatile, there are ways experienced Forex Traders are able to predict the price action of currencies with at least some degree of accuracy.
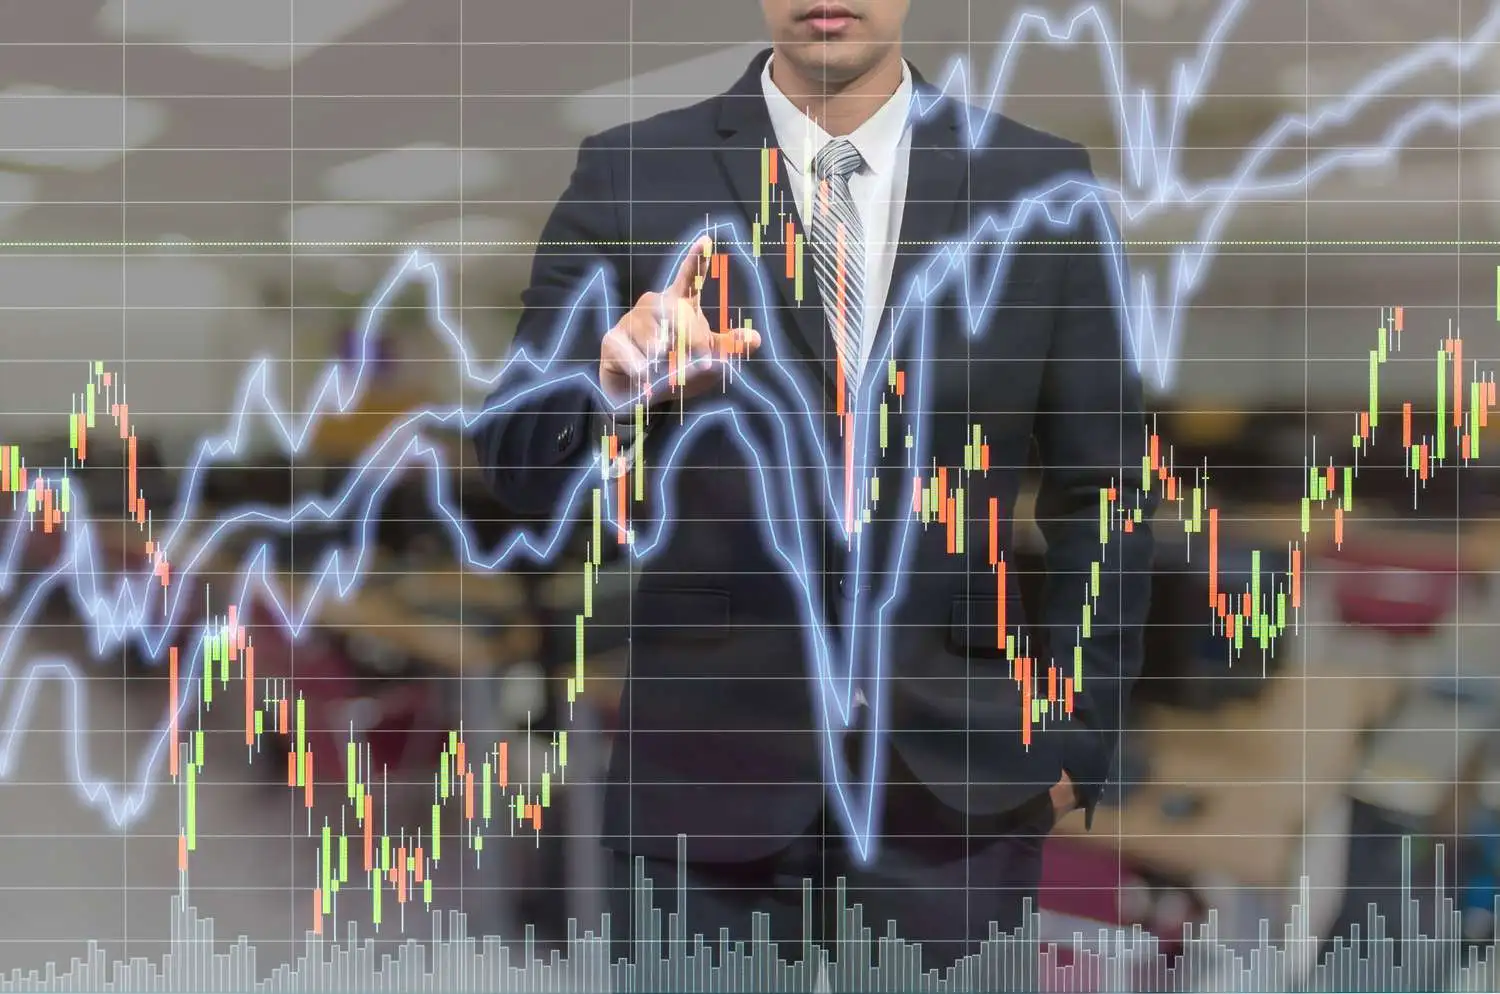
Foreign Exchange Trading (or Forex Trading) is where traders speculate on the price movement of currency pairs.
When correct, and the currency moves in line with their prediction, traders make money.
Although the Forex Markets can be unpredictable and highly volatile, there are ways experienced Forex Traders are able to predict the price action of currencies with at least some degree of accuracy.
One of the most precise and accurate ways traders predict the movement of currency pairs is by using Technical Analysis.
By analyzing historical data, price action, trends, and indicators, traders can get a better idea of what the price of a currency pair may do next.
Although prior data does not guarantee what the price of currency pairs will do, it certainly gives an indication. And when understood and used in conjunction with other indicators, it helps traders make more informed decisions.
However, technical analysis is just one of several tools successful Forex traders use. We will briefly cover the three main types of analysis in Forex before delving deeper into technical analysis.
The three primary types of analysis in Forex Trading are Fundamental analysis, Sentiment analysis, and, of course, technical analysis.
Each has a role in deciding what trades to put on and when. We will explain each of these types of analysis below:
This refers to evaluating currencies relative to what is happening in a country on a fundamental level.
In other words, if a country is doing well, the currency will be expected to strengthen.
Fundamental indicators often referred to include:
-> Interest rate decisions
-> Gross domestic product (GDP)
-> Employment indicators
-> Budget and fiscal policies
When doing fundamental analysis, it is crucial to pay close attention to the news, as changes in a country’s fiscal policies, political instability, or any other news events can significantly impact the price of a currency.
This refers to the general sentiment of market participants towards a particular country, its currency, or both.
Sentiment analysis often follows fundamental analysis.
When the fundamental analysis is positive, the market participants tend to develop a positive (or bullish) sentiment towards a currency.
However, sentiment analysis typically ‘ebbs and flows,’ meaning that market participants can only remain bullish for so long before their sentiment turns bearish.
Some traders use this changing market sentiment to try to catch the reversal of a trend.
This refers to the analysis of price action and volume using technical indicators and tools.
The belief is that historical price actions give reasonably accurate insight into what the price of a particular currency will do.
While fundamental and sentiment analysis gives an indication of the general trend of the market, technical analysis is more specific and focused on when to trade and what trade to utilize.
Traders will often use technical analysis to time their entries and exits in the market. So, while fundamental and sentiment analysis will often help traders decide what stance to take – IE, to be bullish or bearish on a particular currency pair, technical analysis will help traders ascertain when to go long or short.
There are four guiding principles behind technical analysis:
There are three primary trends: bullish (upwards), bearish (downwards), or range-bound (sidewards).
Once a trend is established, it is more likely to continue unless (or until) there is a change in the fundamentals or sentiment surrounding a currency.
While fundamental and sentiment analysis do not involve studying price action and volume directly, technical analysis ‘prices in’ or reflects both fundamental and sentiment analysis.
For example, if market participants are bearish (or negative) on a currency, this will be reflected in downward (or decreasing) price action.
Although the market does not have to repeat prior trends and price movements, it often does.
The market tends to react similarly to previous times. Prior price action and volume give a good indication of what the market may do in the future.
Ultimately, market participants are responsible for moving the markets through going long (buying) or going short (selling).
This brings either buying or selling pressure into the market. Trader psychology – or how traders think and respond is very important, as this helps predict what the market will do.
For example, when there is negative news, trading sentiment regarding a currency tends to turn negative. Therefore, understanding trader psychology helps predict how the market will respond.
Because technical analysis is based on past data, it should not be relied upon as the only tool for making trading decisions.
Therefore, technical analysis should be used as one of several tools in conjunction with other forms of analysis, namely fundamental and sentiment analysis.
Furthermore, technical analysis does not negate the need for strict risk management. Geopolitical news, economic data, and fiscal policies can cause rapid price movements, and therefore technical analysis should not be used in isolation.
However, as mentioned earlier, market trends tend to repeat themselves unless the sentiment of market participants changes, causing price action.
We will briefly look at 5 of the most popular technical analysis tools and how they are commonly used.
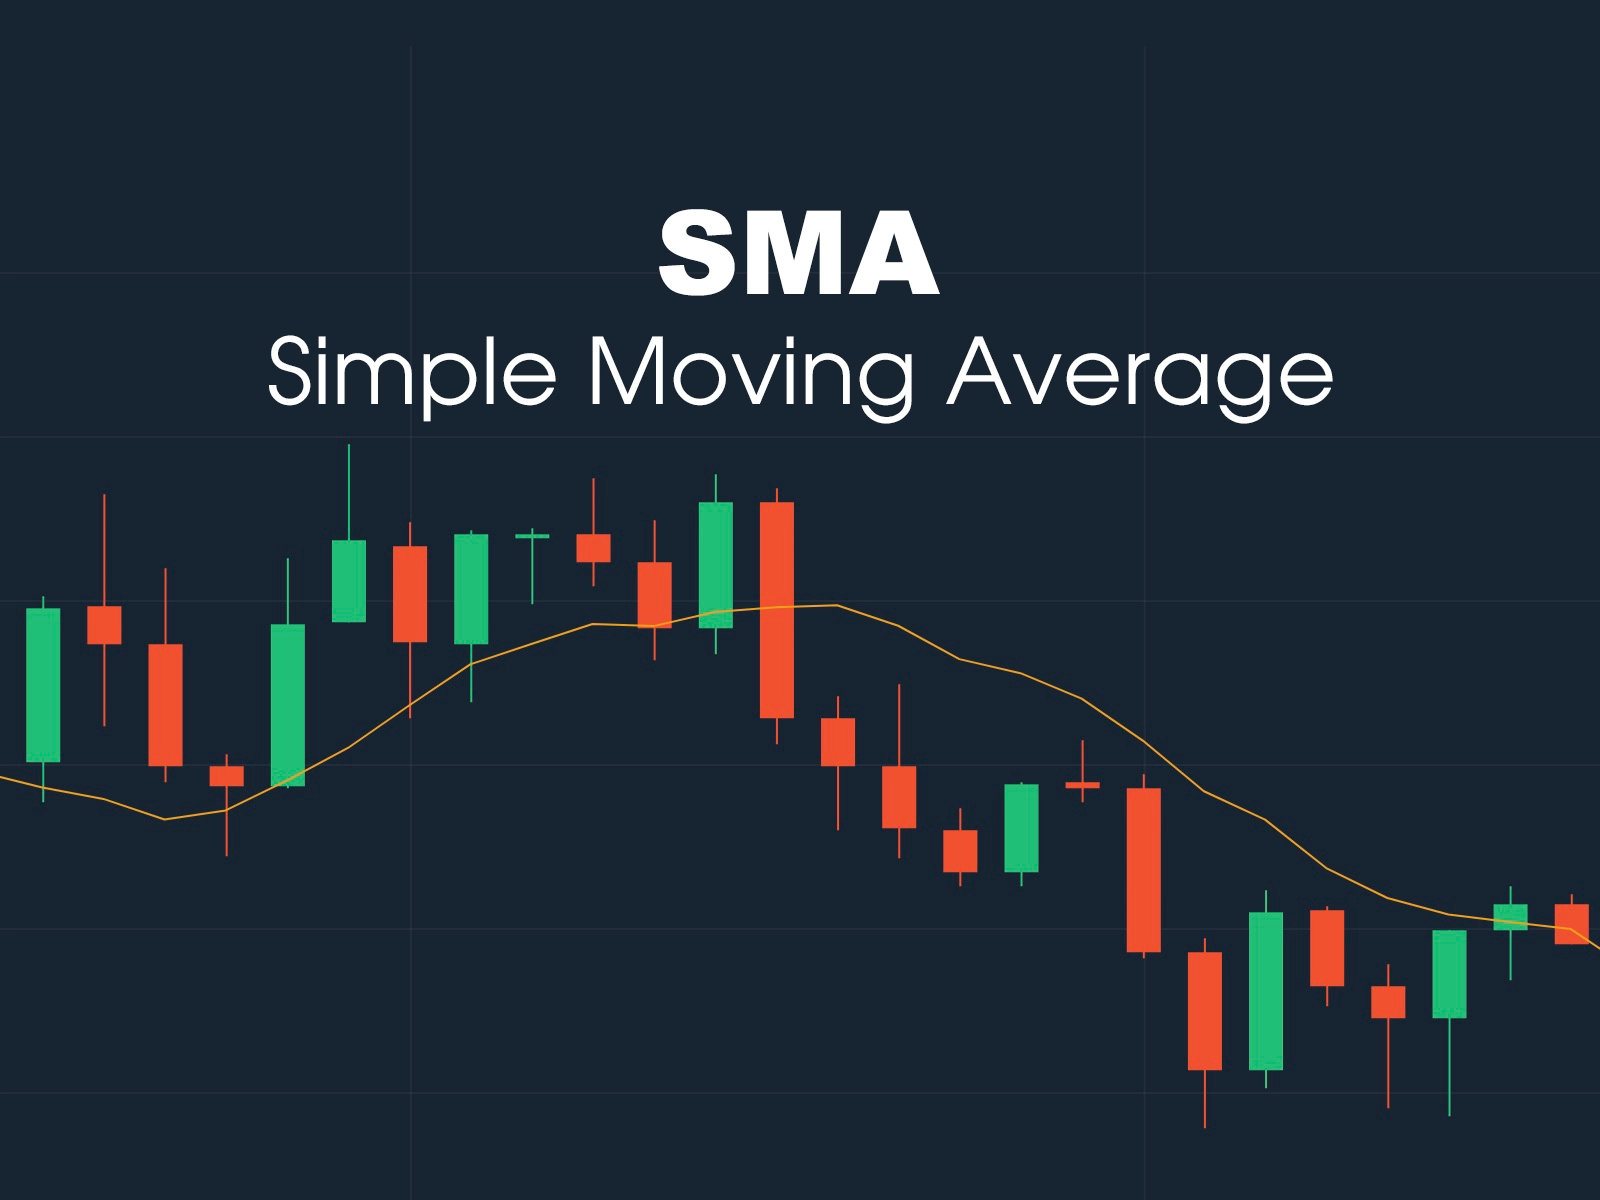
This indicator essentially shows the historical price action over a period of time. Traders will often use this as an ‘average’ of what the price of a currency should be. This can help traders decide to go either long or short.
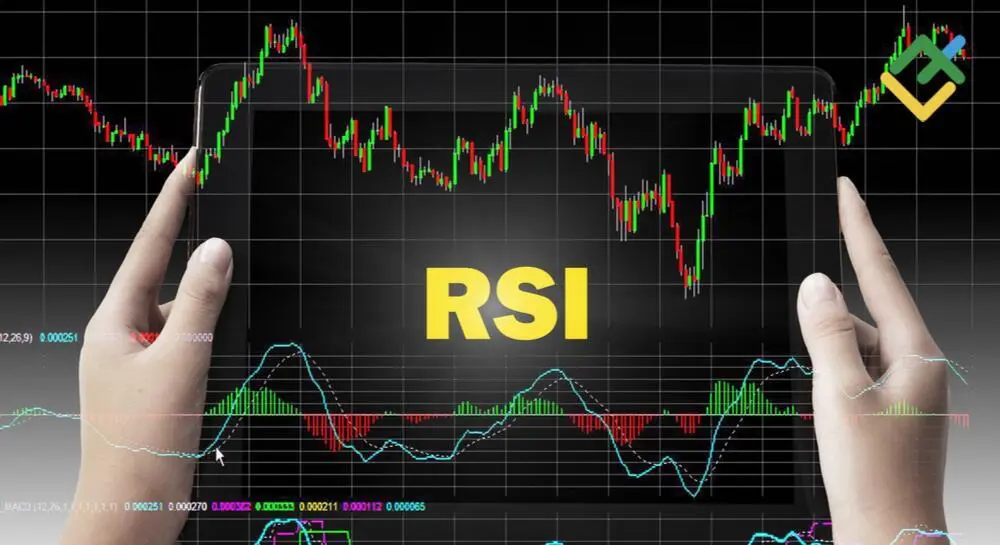
This indicator attempts to measure the relative momentum of an asset or currency. Traders will often use it to try and spot overbought or oversold conditions and anticipate a trend reversal.
This indicator displays price action over a particular time frame. Traders will often use these on a relatively short timeframe to try and spot continuing or reversing market trends, usually for day trading.
These indicators highlight specific ‘price points’ which previously served as either ‘support’ or ‘resistance’ levels. This means that the trend reversed when an asset or currency reached these levels. Traders use these levels to try and predict price movement ahead of time.
Like all forms of analysis, technical analysis cannot be learned overnight. However, it can be mastered over time and become a valuable tool in your trading approach.
Here are five steps to learning technical analysis:
Before diving into charting and learning the different ‘tools’ and ‘techniques’ of technical analysis, understand why historical data is important, how the news impacts price action, and how market participants think.
Learn the basics of each tool, how they work, and how they are commonly used. This includes understanding what support and resistance levels are, different candlestick patterns, and how to read and understand the Relative Strength Index.
Before deploying technical indicators in your live trading, test them using a demo account. Play around with different timeframes, and test the validity of your approach with technical indicators using either current – or past market data.
By watching what others do, you get insight into how they think and incorporate indicators into their decision-making process. Doing this can give you a fresh perspective and help you tweak your own trading strategy.
It is recommended to keep a trading journal when trading to see what works, what doesn’t, and how to become more effective in your trading approach. The same goes for technical indicators: document what works and what doesn’t, and tweak your strategy as you go along.
In summary, technical analysis is based on historical data points, which, although valuable – should never be used in isolation.
Technical Analysis should be combined with other forms of analysis, such as fundamental and sentiment analysis.
Try various indicators and tools and test them in the market to determine which works for you and which doesn’t.
Moreover, constantly learn and evolve your trading strategy, and don’t be afraid to glean from what others do to refine your approach to technical analysis.
18 min read
A funded trading account gives you access to a firm’s capital to trade, share profits, and reduce personal risk.

12 min read
Yes, some prop firms allow news trading. This 2025 guide shows which firms permit it, their rules, and how traders can benefit.

10 min read
A funded trader uses a prop firm’s capital instead of their own. Learn how funded accounts work, profit splits, and how to qualify.

13 min read
To become a funded trader in 2025, you must pass prop firm challenges by mastering strategy, risk control, and trading rules.
9 min read
Discover effective AI trading strategies for prop firms to enhance your profits. Learn practical tips to navigate the market successfully. Read more!
Get an insight from other users about SeacrestFunded and their experiences. 131K+ members and counting

Get instant access to weekly newsletter.